I can’t take all the credit for the Cleveland Indians’ remarkable late-season playoff run; I’m sure their players and coaches had a little to do with it. But I’m sure that they were inspired by a desire to boost the team’s rating on The Plain Dealer/cleveland.com Believe-O-Meter:
The story of the meter, in brief: For the last few years, Indians fans in the cleveland.com comments had floated to the stratosphere or sunk to the abyssal zone with the team’s streaky seasons. A short time into this year’s games, I wondered if we could capture that online. I came up with a name and a general concept, and, like all smart managers, then got the hell out of the way.
Dave Campbell, a sports editor, gathered people to brainstorm and pushed things through to a finished product. Chris Morris, an illustrator, proposed making it fully interactive — site visitors can adjust sliders for “heart” and “head” feelings about the team to create a new datapoint. Pete Zicari, coding maven, got it working. Meanwhile, data whiz Rich Exner developed a stats-based counterpart to provide a dash of reality. Artist Bill Neff designed the jiffy, GIFfy meter itself. (I’m pretty sure Pete (pzicari@cleveland.com) and Rich (rexner@cleveland.com) would be happy to talk to anyone who’d like to build similar tools for their sites.)
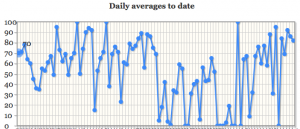
Indians fans: Not the most stable, psychologically speaking.
Go to one of the posts featuring the meter to see all the pieces and parts, including a scatter-plot chart of recent fan entries with rollover one-word comments. I particularly like the “daily averages to date” chart for the fan reactions (I’m fairly sure that was the inspiration of PD design boss David Kordalski, but ideas were flying fast in that brainstorming session), which neatly visualizes the tortured psyches of Cleveland sports fans.
Steal this idea: An interactive sports Believe-O-Meter
Posted in Comments, Online Journalism By John Kroll On September 27, 2013I can’t take all the credit for the Cleveland Indians’ remarkable late-season playoff run; I’m sure their players and coaches had a little to do with it. But I’m sure that they were inspired by a desire to boost the team’s rating on The Plain Dealer/cleveland.com Believe-O-Meter:
The story of the meter, in brief: For the last few years, Indians fans in the cleveland.com comments had floated to the stratosphere or sunk to the abyssal zone with the team’s streaky seasons. A short time into this year’s games, I wondered if we could capture that online. I came up with a name and a general concept, and, like all smart managers, then got the hell out of the way.
Dave Campbell, a sports editor, gathered people to brainstorm and pushed things through to a finished product. Chris Morris, an illustrator, proposed making it fully interactive — site visitors can adjust sliders for “heart” and “head” feelings about the team to create a new datapoint. Pete Zicari, coding maven, got it working. Meanwhile, data whiz Rich Exner developed a stats-based counterpart to provide a dash of reality. Artist Bill Neff designed the jiffy, GIFfy meter itself. (I’m pretty sure Pete (pzicari@cleveland.com) and Rich (rexner@cleveland.com) would be happy to talk to anyone who’d like to build similar tools for their sites.)
Indians fans: Not the most stable, psychologically speaking.
Go to one of the posts featuring the meter to see all the pieces and parts, including a scatter-plot chart of recent fan entries with rollover one-word comments. I particularly like the “daily averages to date” chart for the fan reactions (I’m fairly sure that was the inspiration of PD design boss David Kordalski, but ideas were flying fast in that brainstorming session), which neatly visualizes the tortured psyches of Cleveland sports fans.